Monitor PgBouncer Connection Pools
If clients reach your cluster through PgBouncer, DBCC can monitor each connection pool, chart its throughput over time, and restart PgBouncer automatically when the process fails.
PgBouncer is not part of the SynxDB distribution. Install and configure it yourself on the coordinator and, if you have one, the standby coordinator. DBCC monitors an existing PgBouncer deployment rather than deploying one for you.
What DBCC monitors
Liveness: the agent on each coordinator or standby node connects to the local PgBouncer admin console and runs
SHOW VERSION. A refused connection means the process died; a timeout means the process is alive but unresponsive. Both count as down.Pool and throughput statistics: the agent collects
SHOW STATS,SHOW POOLS,SHOW DATABASES, andSHOW LISTSfrom the admin console and exports them as Prometheus time series. The agent collects statistics on the coordinator only, because a standby carries no client traffic. It collects liveness on both.Self-healing: when the Pgbouncer Down alert fires, DBCC instructs the agent on the affected node to restart PgBouncer.
Prerequisites
The agent always connects to the admin console over the loopback address without a password, so the admin user must be trusted for local connections.
In the PgBouncer configuration file, point
auth_hba_fileat an HBA file and set the admin user:auth_type = hba auth_hba_file = /etc/pgbouncer/pgbouncer_hba.conf admin_users = pgbouncer_auth stats_users = pgbouncer_auth
Trust the admin user for loopback connections in the HBA file:
host all pgbouncer_auth 127.0.0.1/32 trust
Add the admin user to the file that
auth_filepoints at, usuallyuserlist.txt:"pgbouncer_auth" ""
Important
Step 3 is required even though the HBA rule says
trust. PgBouncer rejects a user that is absent fromauth_filewithFATAL: "trust" authentication failed, and the console then reports the node as PgBouncer down.Confirm that the agent’s probe succeeds:
psql -h 127.0.0.1 -p 6432 -U pgbouncer_auth pgbouncer -c "SHOW VERSION"
Enable monitoring
Monitoring is off by default. Upgrading does not turn it on. Two independent switches control it, and you must set both.
On the DBCC server, edit
/etc/dbcc/dbcc-server/application.yml:dbcc: pgbouncer: enabled: true alert: confirmationDuration: 30
enableddecides whether this deployment manages PgBouncer. When it isfalse, the console hides the Connection Pool page and its menu entry, and the Pgbouncer Down alert type is unavailable when you create an alert rule.confirmationDurationis how long, in seconds, PgBouncer must stay down before the alert fires and self-healing starts. Raise it to tolerate brief outages; lower it to react faster.Restart the server:
sudo ./deploy.sh restart dbcc-server
On every coordinator and standby node that runs PgBouncer, edit
/etc/dbcc/dbcc-agent/config.yml:database: pgbouncer: enabled: true port: "6432" user: "pgbouncer_auth" database: "pgbouncer"
Restart the agent on those nodes:
sudo ./deploy.sh restart
Leave database.pgbouncer.enabled set to false on segment nodes. Enabling only the server switch makes the page and the alert type visible but leaves them without data, because no node reports metrics.
View connection pool metrics
Make sure you are logged in to the DBCC:
http://<ip>:8080/
In the left navigation bar, click Connection Pool.
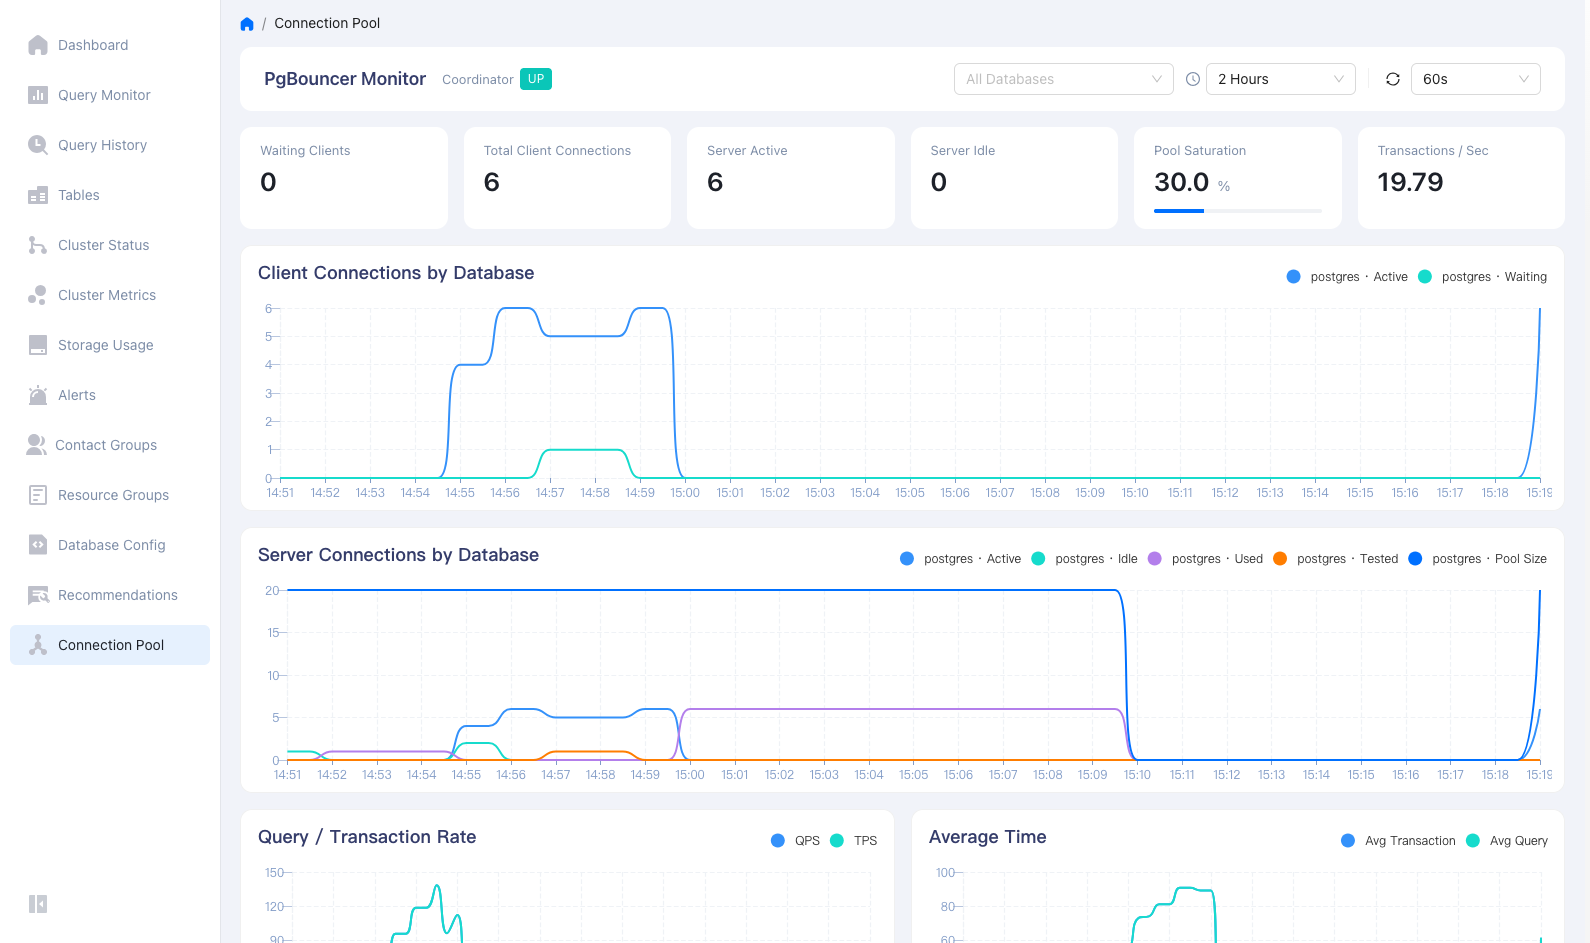
The heading shows which node’s PgBouncer the page charts, together with a badge that reports whether that PgBouncer is currently up. Three controls at the top right work independently of each other:
Control |
Description |
|---|---|
Database filter |
Restricts every chart to the databases you select. |
Time range |
Sets the query window: 2 hours, 6 hours, 1 day, 7 days, or a custom range. |
Refresh interval |
Sets how often the page polls for new data. Use the refresh button beside it to reload immediately. |
The cards across the top report the latest value of each measure:
Card |
Description |
|---|---|
Waiting Clients |
Clients queued because no server connection is free. A sustained value above zero means the pool is too small for the workload. |
Total Client Connections |
Client connections PgBouncer is currently serving. |
Server Active |
Backend connections currently running a query. |
Server Idle |
Backend connections open but idle, ready to be reused. |
Pool Saturation |
Backend connections in use as a percentage of the pool size. |
Transactions / Sec |
Transactions per second across the selected databases. |
Below the cards, the charts plot the same measures over the selected window:
Chart |
Description |
|---|---|
Client Connections by Database |
Active and waiting client connections per database. |
Server Connections by Database |
Backend connections per database, broken out by state, against the pool size. |
Query / Transaction Rate |
Queries and transactions per second. |
Average Time |
Mean transaction and query duration in milliseconds. |
Network Traffic |
Bytes received and sent per second. |
Protocol Usage |
Client parse, server parse, and bind counts per second, which show how much of the traffic uses the extended query protocol. |
Wait Time |
Maximum time clients spend waiting for a server connection, and the rate at which waits occur. |
Queued and Cancelled Clients |
Waiting clients and cancel requests, which rise when the pool is saturated. |
The page reads stored time series rather than sampling PgBouncer on demand. You can therefore look back over a window that has already passed and see how the pool behaved.
Alert on failure and restart automatically
Create an alert rule so that DBCC notifies you and restarts PgBouncer when the process fails.
In the left navigation bar, click Alerts, then click Create Alert Rule.
Enter a name, select the Event type, and choose Pgbouncer Down Alert as the related template.
Select a contact group, set the effective time and priority level, and save the rule.
For details on the fields, see Alert Rules.
After the rule is active, a PgBouncer that stays down longer than confirmationDuration triggers the alert. DBCC notifies the contact group and tells the agent on that node to run:
sudo systemctl restart pgbouncer && sudo systemctl is-active --quiet pgbouncer
Restarting, rather than starting, recovers a crashed process and an unresponsive one alike. If your environment does not use systemd, or PgBouncer runs under a different service name or inside a container, override the command with database.pgbouncer.restartCommand in the agent configuration file. For example:
database:
  pgbouncer:
    restartCommand: "docker restart pgbouncer"
Expect one to two minutes between the failure and the restart under the default settings. That interval covers the collection interval, the export to Prometheus, one scrape, the confirmationDuration wait, and dispatch to the agent. If you need to react faster, shorten pgbouncerUpCollectInterval and exportInterval under databaseMetrics in the agent configuration file, and confirmationDuration on the server.
The coordinator and the standby are tracked separately, so each one alerts and recovers on its own.
Distinguish a failed process from a failed host
The Pgbouncer Down alert covers process-level failures only. It fires when a node reports that its PgBouncer is down, not when the node stops reporting at all. A failed host takes its agent with it and therefore produces no metric to compare against zero, so this alert does not fire and coordinator failover handles the host instead.
This split keeps DBCC from trying to restart a service on a host that is no longer reachable.
Notes and limitations
Enable
database.pgbouncer.enabledonly on nodes that run PgBouncer. On any other node, the probe fails and the console reports that node as PgBouncer down.Throughput and pool statistics come from the coordinator. After a failover, the promoted node takes over reporting.
The page reflects the deployment-wide switch. Setting
dbcc.pgbouncer.enabledback tofalsehides the menu entry and stops DBCC from generating the alert, sending notifications, and restarting PgBouncer, but it keeps the alert rules you already created, which are simply hidden from the Alerts list while the switch is off.